Investigating the land surface temperature (LST) of solar farms in Texas
Analyzed solar farms in West Texas to determine if the land surface temperature (LST) where large solar panels are located is warmer or cooler than the average surrounding area.
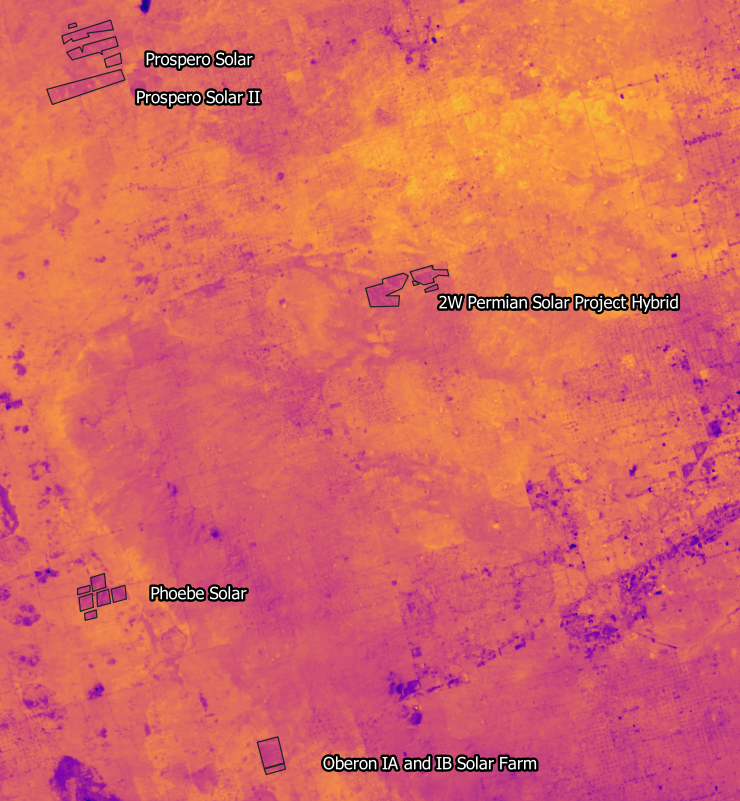
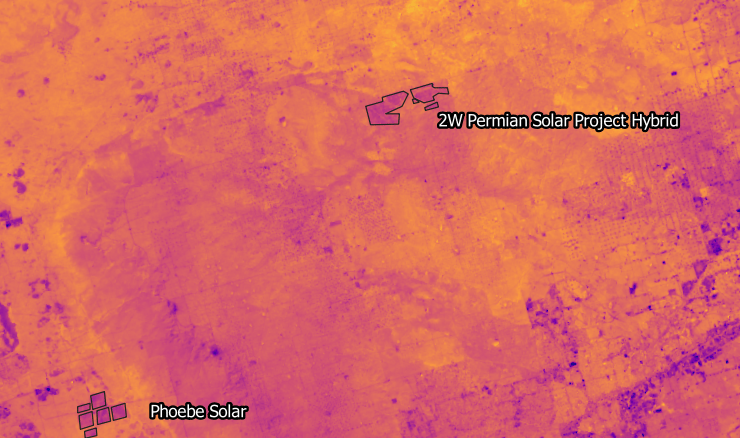
Loaded vector tiles from OpenInfra into QGIS and filtered the data down to solar projects in West Texas and identified 4 solar farms in relative close proximity at roughly 20 miles apart.
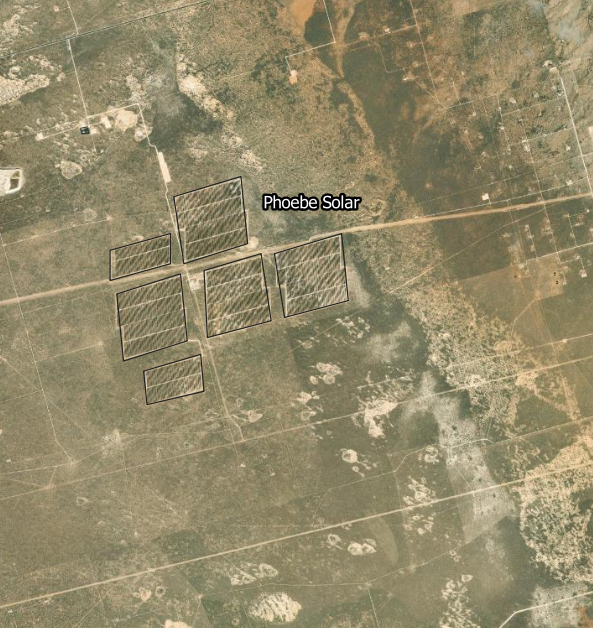
Downloaded Sentinel-2 data and created a virtual raster using bands 2, 3 and 4 to confirm there were indeed solar panels installed at the solar sites during the time of the corresponding Landsat capture. This step was necessary because solar panels didn’t originally appear on Google or ESRI satellite imagery for two of the OpenInfra solar polygon areas.
Downloaded Landsat imagery for the area of interest and derived land surface temperature (LST) measurements from Landsat bands 10 and 11 using the Semi-Automatic Classification (SCP) plugin in QGIS.
Findings of the analysis were surprising: the LST where the solar projects were located was actually lower than the surrounding areas. On average, the LST measured at solar sites was 10 degrees (F) cooler vs the surrounding area. This can observed in the image above where the darker purple colors represent cooler LST vs the lighter yellow which represents warmer LST. A close up on the Phoebe Solar project is included below where this contrast can be observed in more detail.
Conducted quick research to see if any similar studies had been conducted and if they confirmed this conclusion.
Found evidence that supported the conclusion that the cooling was caused by a combination of shading and insulating the land surface, and by the direct conversion of energy into electricity by the solar panels.

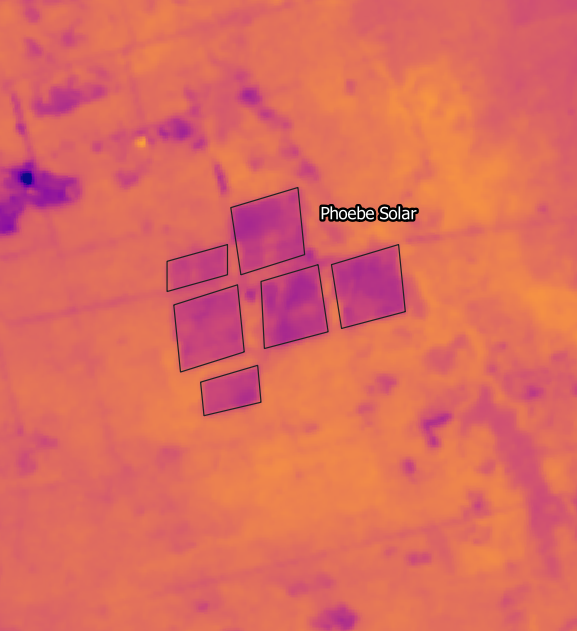

Phoebe Solar LST of 65 degrees Fahrenheit (in purple) vs 75 degrees in surrounding yellow areas
Phoebe Solar is an 315 MW operational solar project located in Winkler County, Texas